CCseqBasic
~ Quality control and runtime log files

The top of the page contains the total counts for interactions, for each capture site.

It also contains a summary bar graph, to describe the quality of the NG-Capture-C library.
This part of the quality control page is described in the Interaction counts page insteadThe rest of the page contains various runtime logs and Quality Control measures performed during the analysis steps

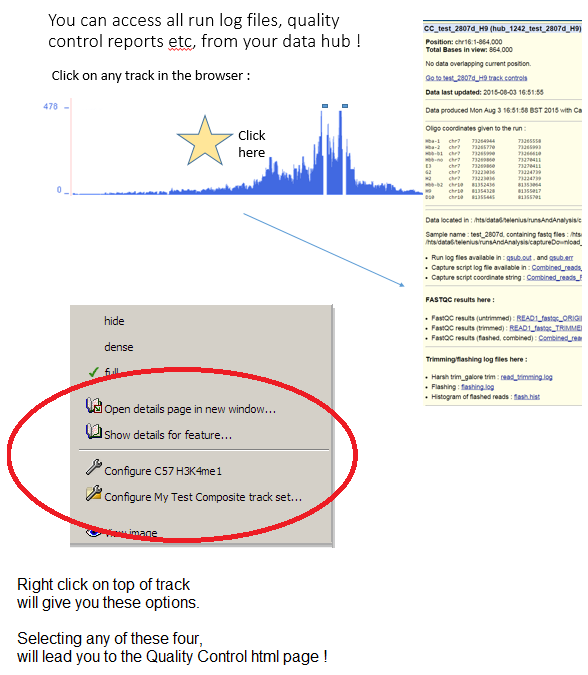
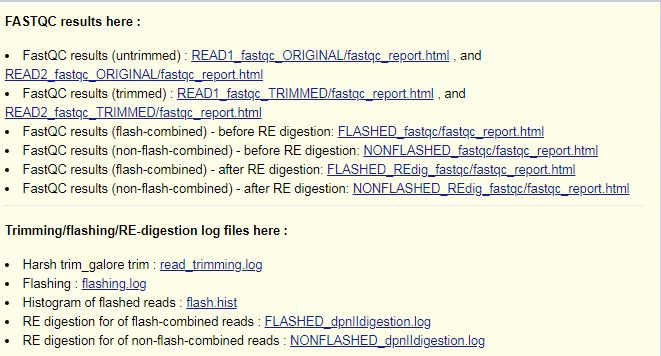
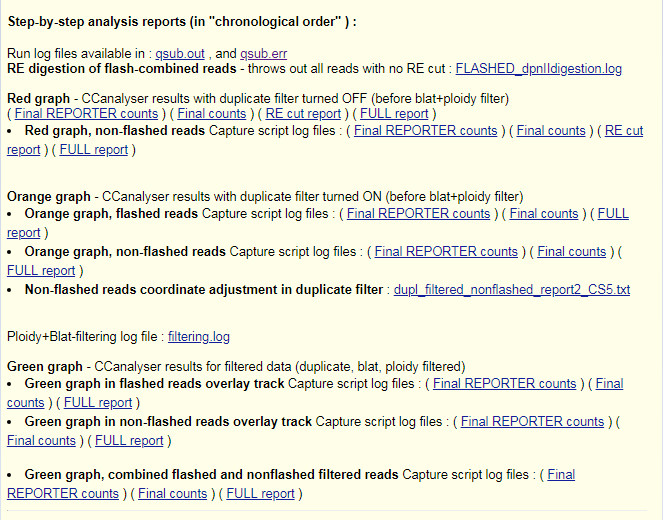
The rest of the page contains all run steps, carefully documented. The order of the reports follows the output folder structure.

To better understand the value and use of these reports, it is recommended to dig deeper into pages :
Interaction counts (and how to interpret these)
Output folders (what do you get and how to browse)
Analysis steps (what does the run do ?)