CCseqBasic - for CaptureC data analysis
The CCseqBasic analyser is a pipeline over James Davies' CCanalyser ( analyseMappedReads.pl )
This document does NOT give a detailed listing of the output folders and files. For this - see the Output folders page instead.
Tools used above : (1) trim_galore, (2) FLASH, (3) bowtie1/2
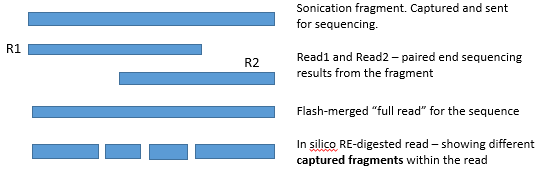
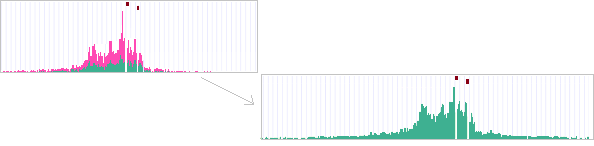
These RE-digested fragments can now be mapped to reference genome.
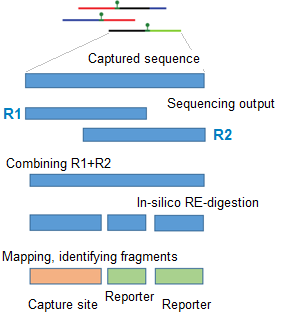
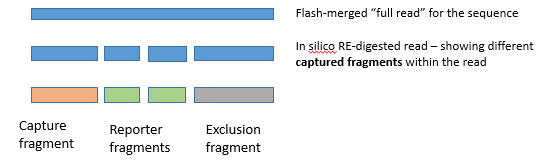
Program called "flash" is used to combine the reads (when R1 and R2 overlap) to a single read
"Flashed reads" are the reads the program was able to combine to a single entity (overlap of R1 and R2 reads was found)
  R1
  |------------

      ----------------| R2


  |-------------------|   flashed read (combining R1 and R2 to a single entity)
"Non-flashed reads" are the reads the program was not able to combine to a single entity (no overlap of R1 and R2 reads was found)
  R1
  |---------

                 -----------| R2


  |---------     -----------|   non-flashed read (R1 and R2 cannot be combined,
                                  and continue to analysis as separate entities)
This means : there was no overlap, or the overlap was not "convincing enough" (contained a lot of mismatches, or was very short overlap)
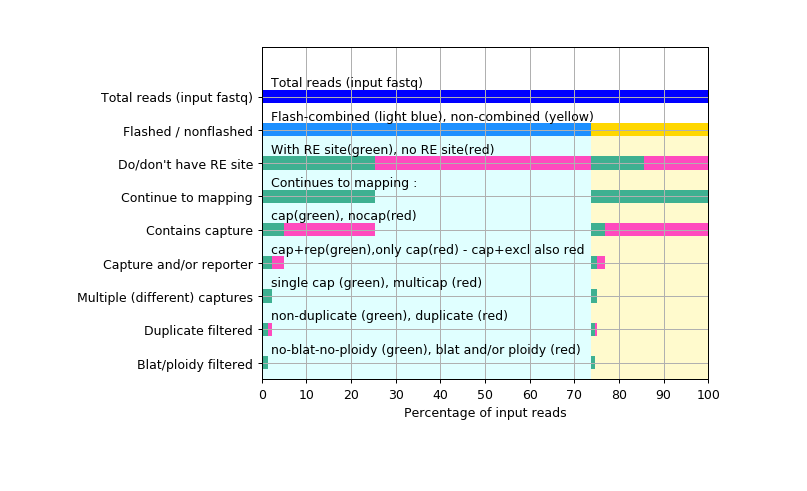
In capture-C analysis we need to separate between multiple different fragment types.
Here the details and illustrations
about this
Before reading the text below , check the link above : browse through the illustrations -
to get a clear picture what the text below refers to !
The above (2 Analysing mapped reads) is done multiple times, like so :
Reporter fragments overlapping known blacklisted regions (intra-house peak call for mm9, lift-over of this for mm10, Duke Blacklisted regions for hg18 and hg19) are removed from the results.
The blacklisted regions are generally very repeat-rich regions, which generate deep (but artifactual) signals in the data. These "false positive" peaks are seen in all samples, in all data types (ChIP-seq, ATAC-seq, RNA-seq, captureC), and if some of these regions are within the interaction region of any of the capture probes, convincing-looking interaction signal can result, and this may lead to false interpretation of the data.
If you are interested in repeat-rich regions, you may wish to turn this filter off, by running CCseqBasic with --noBlacklistFilter
Homology region filtering :Each of the capture-site-containing-RE-fragments + its "exclusion zone" are mapped to whole genome. ( "Exclusion zone" : see the "illustrations" above )
This is done to avoid embarrasment : sometimes long range cis and trans interactions can be seen just because the capture site happens to resemble closely ANOTHER location in the genome (and mismapped reads cause this to show up as a long range "true" interaction).
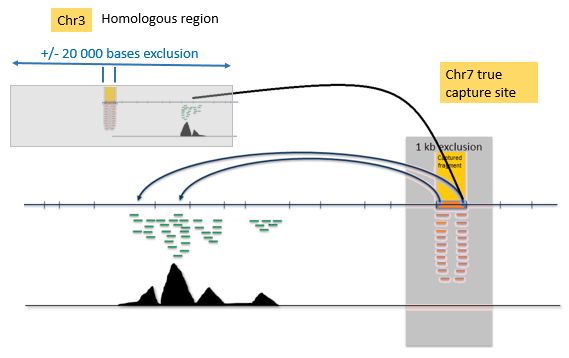
If homology regions are found, the reporter fragments from these homology regions are eliminated (+/- 20 000 bases filter around each found homology region), except hits +/- 200 000 bases from the target site itself, to not to filter short-range cis contacts.
   Default blat parameters are :
   minMatch=2 tileSize=11 maxIntron=4000 stepSize=5 minScore=10
  (and can be modified with user-given flags)

  These default parameters mean that the program searches for
  11-base wide homology regions (full matching 11 bases minimum)
  and if it finds at least 2 of these
  separated separated by maximum 4000 bases from each others,
  this triggers a homologous region - and all of these are to be removed in the blat-filtering step.
  Step size determines how often this "search for homology" is restarted. Here we do in 5 bases steps
  along whole genome.
  Min score triggers "how similar" the sequences need to be to trigger a homologous region.
  Value 10 (used here) flags regions as homologous relatively easily.
Each of these iterative steps (steps 3 above) are done twice - once for flash-combined )"flashed" reads, once for "non-flashed" (non-combinable) reads.
This is to make troubleshooting easier : often the "flashed" and "non-flashed" reads have different kind of problems in the analysis.
|-------------------------| flashed read
|--------- -----------| non-flashed read
In the end, these two analyses are combined, to yield the final amount of reported reads :
The above visualisations, quality control reports, and interaction counters, are described in the main page : CCseqBasic main page instead.
The CCseqBasic main page also contains detailed run instructions, test data set, and description of output folder contents.