CCseqBasic
~ Visualisations, and UCSC data hub


Details below !
CCseqBasic run generates many USCS data hubs.
You can find the html links of these in the end of your run output log. This html link is needed for loading the data hub into the UCSC browser - for browsing it !
The last 10 lines of your output log will tell you all the available ones, as well as instruct you how to load these to UCSC browser.
If your output log is called 'qsub.out', (here for sample called 'test7' , ran with CCseqBasic version 'CS5' ):
[telenius@deva test7]$ tail -n 10 qsub.out

Generated a data hub for RAW data in :                http://userweb.molbiol.ox.ac.uk/public/telenius/test7/C
( pre-filtered data for DEBUGGING purposes is here :  http://userweb.molbiol.ox.ac.uk/public/telenius/test7/C
Generated a data hub for FILTERED data in :           http://userweb.molbiol.ox.ac.uk/public/telenius/test7/C
Generated a data hub for FILTERED flashed+nonflashed combined data in :     http://userweb.molbiol.ox.ac.uk/p

Generated a COMBINED data hub (of all the above) in :     http://userweb.molbiol.ox.ac.uk/public/telenius/tes
How to load this hub to UCSC : http://sara.molbiol.ox.ac.uk/public/telenius/DataHubs/ReadMe/HUBtutorial_Allgr

[telenius@deva 1]$
Here the above How to load this hub to UCSC -link in its entirety : http://sara.molbiol.ox.ac.uk/public/telenius/DataHubs/ReadMe/HUBtutorial_AllGroups_160813.pdf
This hands-on pdf illustrates how to copypaste the above html address to correct place in UCSC server, and start browsing !
Data hubs are very handy for re-use purposes as well, easy to generate and modify !
Here the UCSC european mirror pages, to instruct you to the secret world of data hubs :
Generated a data hub for RAW data in :                http://userweb.molbiol.ox.ac.uk/public/telenius/test7/C
( pre-filtered data for DEBUGGING purposes is here :  http://userweb.molbiol.ox.ac.uk/public/telenius/test7/C
Generated a data hub for FILTERED data in :           http://userweb.molbiol.ox.ac.uk/public/telenius/test7/C
Generated a data hub for FILTERED flashed+nonflashed combined data in :     http://userweb.molbiol.ox.ac.uk/p

Generated a COMBINED data hub (of all the above) in :     http://userweb.molbiol.ox.ac.uk/public/telenius/tes
The most complete of these is the COMBINED data hub (of all the above) The contents of that are described below in detail.
If you want to see only the final filtered data (no quality control or filtering tracks), you can load the Generated a data hub for FILTERED flashed+nonflashed combined data instead.
The other data hubs contain folder-wise analysis results :
( if you don't know what are these output folders F2-F6 , check the section "output folders" in the main page )
All of the hubs also contain direct access to the html page of quality control, run log files, and interaction counts. More about this in the main page, under "QC and html page".
By default these tracks are visible (here for sample called 'test7' , ran with CCseqBasic version 'CS5' , having only one capture site called 'Hba-1' ) :
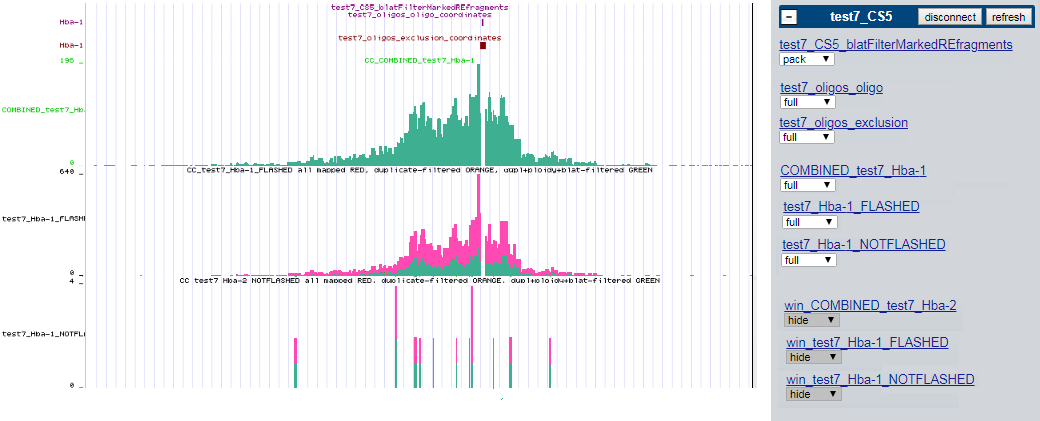
The rest of the tracks are the 'interaction counts' tracks. Binned to the "natural bin unit" of RE (restriction enzyme) fragments. One track per capture site.
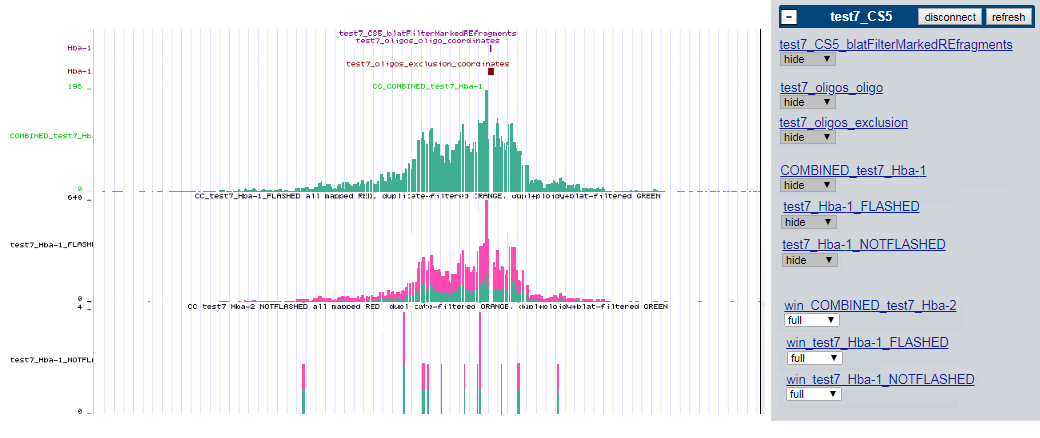
By default these tracks are hidden (here for sample called 'test7' , ran with CCseqBasic version 'CS5' , having only one capture site called 'Hba-1' ) :
These tracks are raw 'interaction fragmnts' tracks (for troubleshooting purposes). Raw mapped bam fragment distribution, smoothed with 300 base window and 30 base slide. One track per capture site.
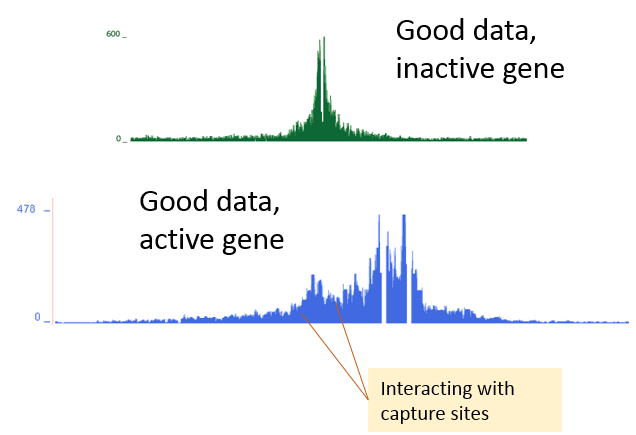
This one (above) is very good quality data – these track are high enough resolution for differential peak analysis. Note the high read distribution peaks right next to the capture sites (capture sites marked with blue boxes) – this is a sign of high enough sequencing depth. If your capture experiment includes inactive genes as negative control, they show the “raw capture signal” : this is how capture looks like, if there is NO interactions between the capture site and other genomic regions nearby ! Including this kind of negative control to your design, makes it easy to see if your sequencing depth was high enough – shape like this in a negative control is a sure sign of high quality data. When the tracks look like this, you expect to find ~ 30 000 - 50 000 unique interactions for each capture site.
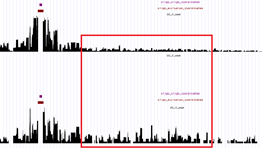
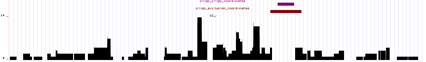
These ones (above) are a pair of somewhat low interaction count samples. The “signature peaks” next to capture fragments are not very strong (especially in the lower sample) – indicating a possibly little too low sequencing depth. It is possible to see "by eye" where these two samples differ (the red box) - but these differences will probably not have significant p-value in statistical analysis. These samples have potential, but cannot be analysed 100% reliably on this sequencing depth. If there are replicates available, they can also help in determining, which part of the signal is “real”. You should also consult the diagnostic bar graph (see main page - "interaction counts") and the QC and tool runtime logs (main page - "QC html page") to get clearer view on the possible issues in the experiment, and to identify possible errors in setting up the analysis run, problems within the analysis run.
This one (above) is very low data interaction count sample –the “signature peaks” next to capture fragments are almost entirely absent. This may also be a “not-so-well” succeeded experiment, in which case the higher sequencing depth would not fix the issue. This kind of track may result in weak oligo (designed against very closed chromatin). Or the design including a "greedy" oligo (pulling down also repeat-rich regions, thus "taking over the library", and dwarfing all other interaction signals). Or the capture step of the experiment (or any other step) failing - leading to sequencing of mostly only genomic background. The latter point can be verified by visualising the BAM files of F1 folder of the output. If only genomic background is seen ( no enrichment in the capture sites ) - this ensures the diagnosis of badly worked capture step. The library can be re-captured and re-sequenced. You should also consult the diagnostic bar graph (see main page - "interaction counts") and the QC and tool runtime logs (main page - "QC html page") to get clearer view on the possible issues in the experiment, and to identify possible errors in setting up the analysis run, problems within the analysis run.
If you have sensitive data, you should not use data hubs to browse your data. In this case - make sure your CCseqBasic/config/serverAddressAndPublicSetup.sh file does not provide a real server address.
If your team has a dedicated system admin, you may ask for him/her to install a private UCSC mirror for you, accessible only intra-house. This needs some dedication, though. https://genome-euro.ucsc.edu/goldenPath/help/mirror.html
UCSC also provides easy-to-install single-user browser, called GBiB (genome browser in-a-box), which is easy to set up. https://genome.ucsc.edu/goldenpath/help/gbib.html
If these solutions are not for you - you can always browse the bigwig files in the output folders, and load them to your genome browser of choice (such as GBrowse or JBrowse or IGV).
The html page of quality control and run output log files can also be viewed locally. More about this in the main page - section "QC and html page"
The bigwig files are generated into the public directory you gave in your --pf parameter. If you didn't give anything, they are generated into folder called UNDETERMINED in the run folder.
Using symbolic links instead of filesIf you used parameter --useSymbolicLinks the --pf parameter determines the location of the SYMBOLIC LINKS to the visualisation files.
This serves well data areas where the public disk space is limited, but symbolic links to other (larger) data-areas can be used to "expand" it.
When --useSymbolicLinks is in use, the bigwig tracks are collected to the run folder, under folder PERMANENT_BIGWIGS_do_not_move .
The warning "do_no_move" describes the vulnerability of the symlinks - if you move this folder (or re-organise your runs) resulting the absolute path of this folder to change, the data hub (in the server disk) will break, as the symlinks will not work any more.
List of generated BigWigsTo generate and re-use the visualisations, the BigWigs are named like so : (here given for a CCseqBasic CS5 version run, where only one capture site 'Hba-1')
Folder F2 (raw unfiltered) bigwigs

RAW/FLASHED_REdig_CS5_Hba-1.bw
RAW/NONFLASHED_REdig_CS5_Hba-1_win.bw
RAW/NONFLASHED_REdig_CS5_Hba-1.bw
RAW/FLASHED_REdig_CS5_Hba-1_win.bw

Folder F3 (duplicate-filtered) bigwigs

PREfiltered/FLASHED_REdig_CS5_Hba-1.bw
PREfiltered/NONFLASHED_REdig_CS5_Hba-1.bw
PREfiltered/NONFLASHED_REdig_CS5_Hba-1_win.bw
PREfiltered/FLASHED_REdig_CS5_Hba-1_win.bw

Folder F5 (duplicate+homology+blacklist filtered) bigwigs

FILTERED/FLASHED_REdig_CS5_Hba-1.bw
FILTERED/NONFLASHED_REdig_CS5_Hba-1.bw
FILTERED/NONFLASHED_REdig_CS5_Hba-1_win.bw
FILTERED/FLASHED_REdig_CS5_Hba-1_win.bw

Folder F6 (duplicate+homology+blacklist filtered, combine) bigwigs

COMBINED/COMBINED_CS5_Hba-1.bw
COMBINED/COMBINED_CS5_Hba-1_win.bw
( if you don't know what are these output folders F2-F6 , check the section "output folders" in the main page )